Saturday 6 September 2014

Rounding and Estimating

When estimating a calculation the usual rule is to round each calculation to 1 significant figure.

1st what is a significant figure?
The word significant means: having meaning.

With the number 3 468 249, the 3 is the most significant digit, because it tells us that the number is 3 million and something. It follows that the 4 is the next most significant, and so on.

So if we want to round this number to 1 significant we round it to the nearest million as this is where the first significant figure is

Examples:
Round the following to 1 significant figure

4325 is 4000 (because the 4 is the 1st significant figure so we round it to the nearest thousand)

0.007821 is 0.008 the 7 is the 1st significant figure so we round it to 3 decimal places.

Now on to estimating.  To estimate we round to 1 significant figure then work out the calculation

Estimate the answer to 19.4 over 0.0437

First round each number to 1 significant figure so 19.4 becomes 20 and 0.0437
is 0.04

Now we need to make the denominator a whole number. We can do this by multiplying both 20 and 0.04 by 100.         20 over 0.04 = 20 x 100 over 0.04 x 100 = 2000 over 4

Divide everything by 4.
= 2000 over 4 = 500
(Question taken from GCSE Bitesize http://www.bbc.co.uk/schools/gcsebitesize/maths/number/roundestimaterev4.shtml)

Ordering Fractions and Converting between fractions and decimals

When ordering fractions there are two main ways to do this

1) Convert each fraction to a decimal and then order

                                        or
2) Write each fraction over a common denominator.

Example of method 2)


If we are to use method one we need to know how to convert fractions to decimals.  Some are easy such as 1/2 = 0.5 and 1/4 = 0.25.

If we come across a fraction that we do not know as a decimal and we cannot compare it to percentages to help us we can use division to help us.


Sunday 6 April 2014

Angles and Angle Theorems

Different sized angles have different names. These are illustrated below


There are many different angle theorems some are listed below:
 
Adjacent angles on a line add up to 180 degrees


 Angles at a point add up to 360 degrees


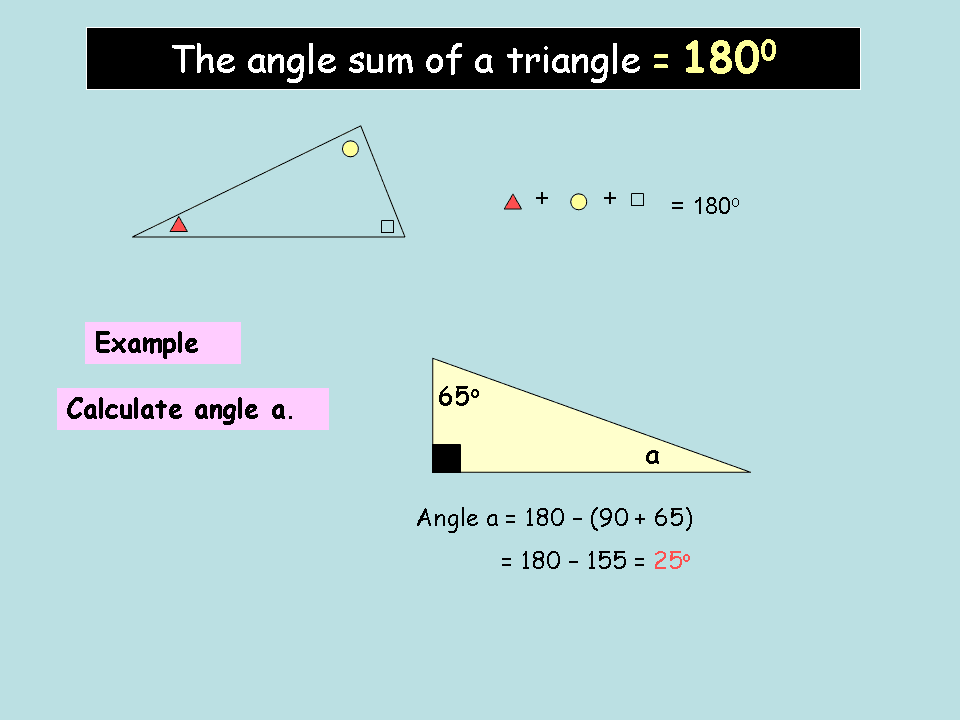
Angles in a triangle equal 180 degrees


Angles in parallel lines

Thursday 20 March 2014

Solving Equations

To solve equations we use inverses (do the opposite) to find out what the unknown is

One step equations

Examples:

1)        2x = 8              We divide both sides by 2 to get x on its own
             x = 4

2)      x + 5 = 9           We subtract 5 from both sides
               x = 4

3)     x - 2 = 12            We add 2 to both sides
             x = 14

Two step equations

Examples:

1)      2x + 1 = 5           First we subtract 1 to get 2x on its own
                      2x = 4          Then we divide both sides by 2 to get x
                 x = 2

2)       3x - 5 = 16         Add 5 to both sides
               3x =  21        Divide both sides by 3
                 x = 7

3)       7 - 4x = 3           Because we have a minus 4x we add this first 
                 7 = 3 + 4x   Now subtract 3
                 4 = 4x         Divide both sides by 4
                 x = 1

Unknowns on both sides

Examples
  
1)       2x + 3 = x + 5     Deal with the smallest x in this case x on the RHS
           x  + 3 = 5            Now continue as above
                 x = 2

2)      3x - 7 = 5x + 9     Be careful with negatives
              -7 = 2x + 9
             -16 = 2x    
              - 8 = x

Equations with Brackets

First multiply out the brackets then continue as above
Examples

1)      3(2x + 5) = 33
            6x + 15 =  33
                    6x = 18
                     x = 3

2)    2(x  + 7) = 3(2x - 2)
        2x  + 14 = 6x - 6
                 14 = 4x - 6
                 20 = 4x
                  5 = x


Saturday 15 March 2014

Probability

Probability all is all about the chance of something happening.

Probability Words
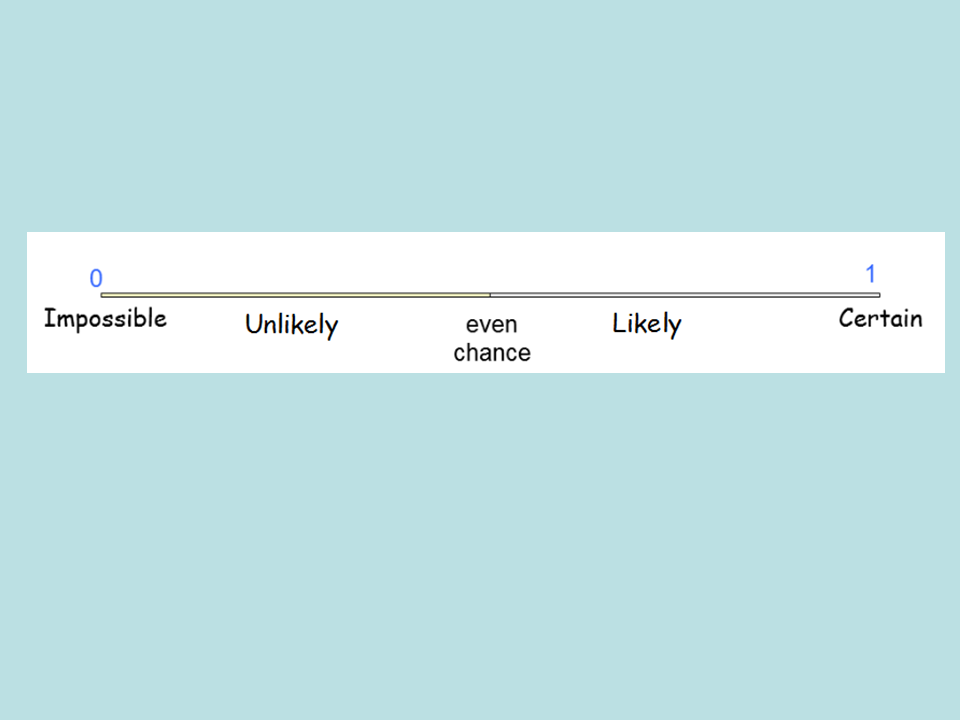
If a question asks you to describe the probability using words the words most often used are

Impossible - Absolutely no chance it will happen
Unlikely - there is a small chance it will happen
Even Chance - the probability is a half or 50 - 50
Likely - it is not definitely going to happen but there is a good chance
Certain - it will definitely happen.

These words can be displayed, with numbers along the probability scale.


The Probability Scale


Probability Calculations

Probability of something happening
If the question asks you to calculate the probability the answer will need to be given as a numerical answer usually a fraction but sometimes written as a decimal or percentage.

To calculate the probability of something happening we use the following formula


Example:  The probability of getting a 5 when rolling an ordinary dice is 1/6 because there is 1 number 5 on the dice out of 6 possible different answers.

The probability if getting an Ace from a standard pack of cards is 4/52 because there are 4 aces and 52 cards this can be simplified to 1/13.  You could also say that it is 1/13 because there are 13 cards in a suit and 1 of them is an ace.

Probability it doesn't happen
The probability of something not happening is 1 - the probability it does.  This is because either that thing is going to happen or it will not happen and so it covers all possibilities and together they equal 1.

Example:  The probability it will rain tomorrow is 0.56 so the probability it won't rain is 1 - 0.56 = 0.44

Experimental Probability and Relative Frequency
Probability can be used to predict results or to see if something is fair.  For example if I flip a coin 10 times theoretically we should get 5 heads and 5 tails but in reality we may get 7 heads and 3 tails.  From 10 results this may not seem odd, but if we flipped a coin 1000 times and got 700 heads and 300 tails you may think the coin is biased.

Relative frequency is the probability that an experiment produces.  For example above where I flipped my coin 10 times the theoretical probability of a head is 0.5 but in the experiment I got a head 7 out of 10 times so the relative frequency or experimental probability is 0.7.

Thursday 6 March 2014

Transformations

Rotation:

When performing a rotation we need 3 pieces of information:

A centre of rotation (either given as a point or sometimes described as the origin which is the point (0,0))

A direction - either clockwise or anti clockwise (Unless the angle is 180 degrees where it doesn't matter)

An angle.

To perform a rotation use tracing paper and trace your shape, place your pencil on the centre of rotation and rotate the given angle in the given direction to see where the shape is rotated to.

Reflection:

When performing a reflection we need to know which line is the mirror line.  This will either be given on the question or expressed as an equation of a line.

Remember x = 2 is a vertical line which passes through the x axis at the point 2 and y = 3 would be a horizontal line which passes through the y axis at the point 3.

A reflection should look like a mirror image and a mirror can be used if you need extra help.

Translation:

A translation is where an object is moved (without reflecting, rotating or enlarging).  Usually the translation will be described by a vector, where the top number represents the x direction and the bottom number the y direction.

Enlargement:

There are two types of enlargement, one without a centre and one with.
A basic enlargement requires you to enlarge a shape by a given scale factor but it doesn't matter where the shape is drawn.  If a shape is enlarged by scale factor 3, each side of the original shape needs to be multiplied by 3 to give the enlargement.

An enlargement from a given centre requires you to draw an enlargement the centre also specifies where the shape should be drawn.

See the example below:

Sometimes an enlargement can make a shape smaller, but this is still called an enlargement, this happens when the scale factor is between 0 and 1.

Describing a transformation

When you describe a transformation you need to look at what has happened to the original shape.  Has it been turned (it's a rotation), flipped (a reflection), made bigger or smaller (an enlargement) or simply just moved (a translation).  You will also need to describe how so if it's a rotation remember the 3 bits of information needed 1) Centre 2) Direction 3) Angle.  If it is a reflection write down the mirror line as an equation.  If it is an enlargement write down the centre and the scale factor and if it's a translation write down the vector by which it has been translated.

Sunday 2 March 2014

Drawing Quadratic Graphs

A quadratic graph will always be a u or n shape depending on whether it is positive or negative.

Always draw your graphs using a pencil and they should be a smooth curve going through all your plotted points

To draw a quadratic graph you will be given an equation and you will need to use x values to create y values to enable you to draw your graphs.

See the example below